Plots
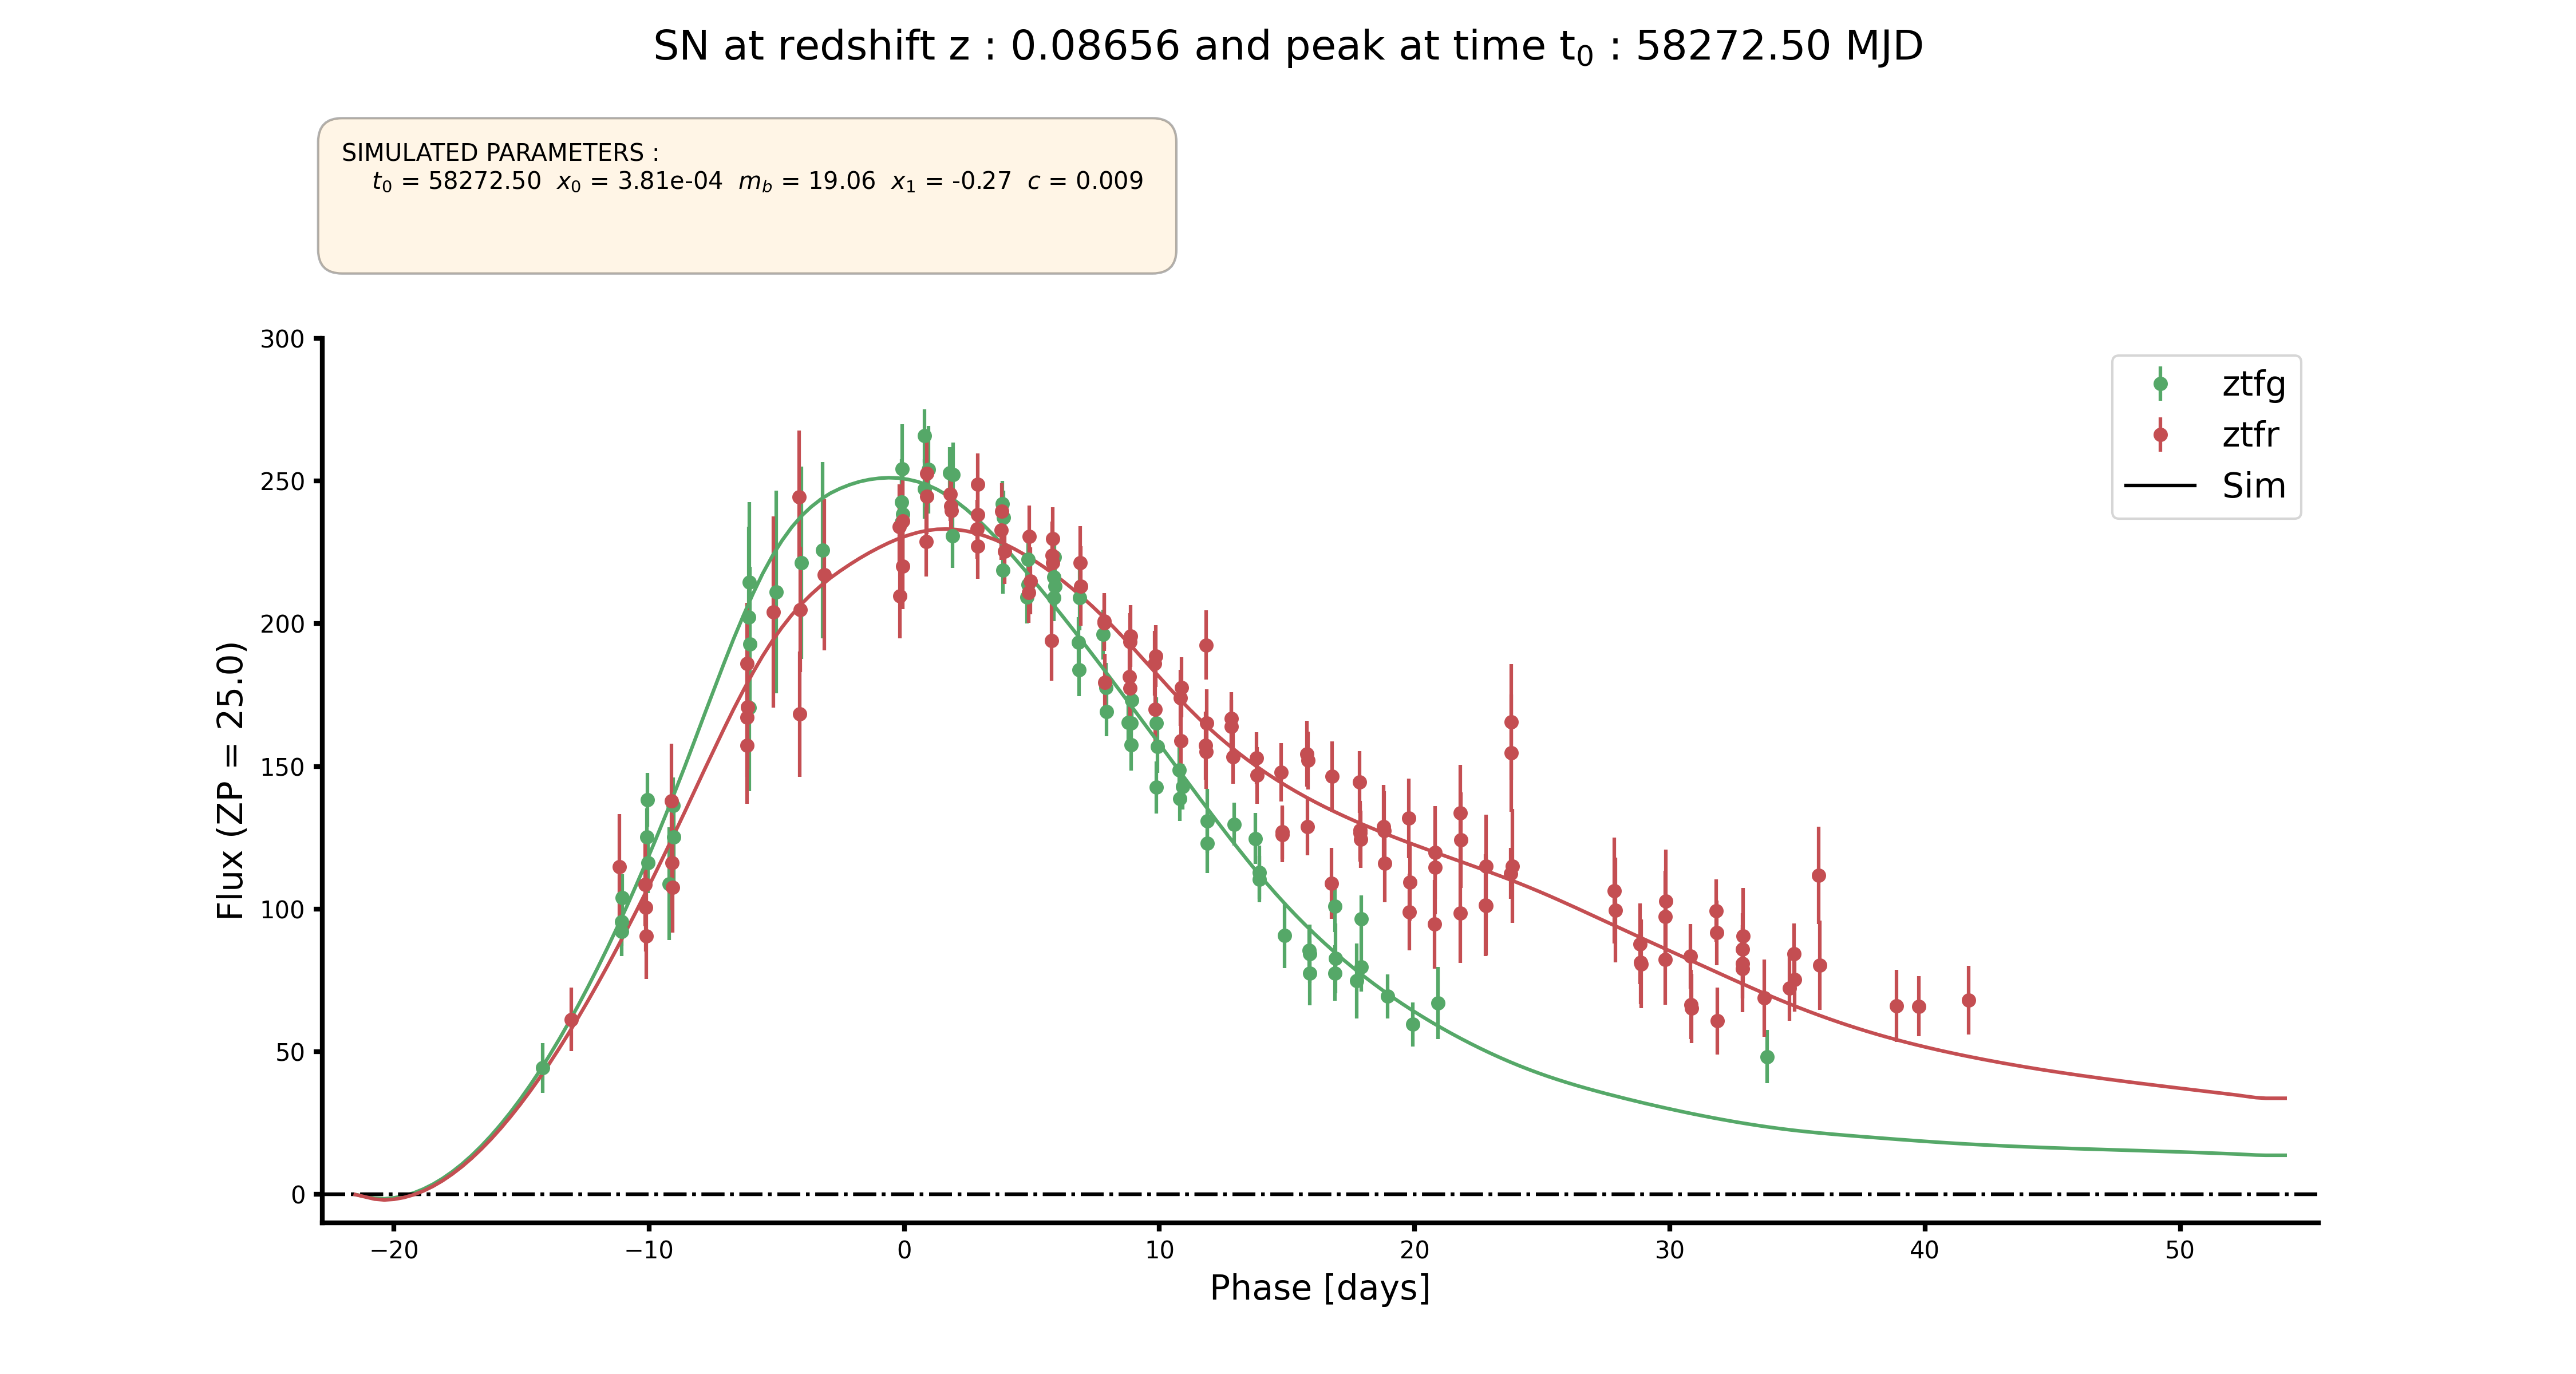
Light-curves
You can plot light-curves directly after simulation or using the SNSimSample module.
# From simulation
Simulator.samples[sampleID].plot_lc(obj_ID, plot_sim=True, plot_fit=False, **kwargs)

# From SimSample
SimSample.plot_lc(obj_ID, plot_sim=True, plot_fit=False, **kwargs)
Kwargs are described in plot_utils.plot_lc API.
Plot sim :
Plot fit :

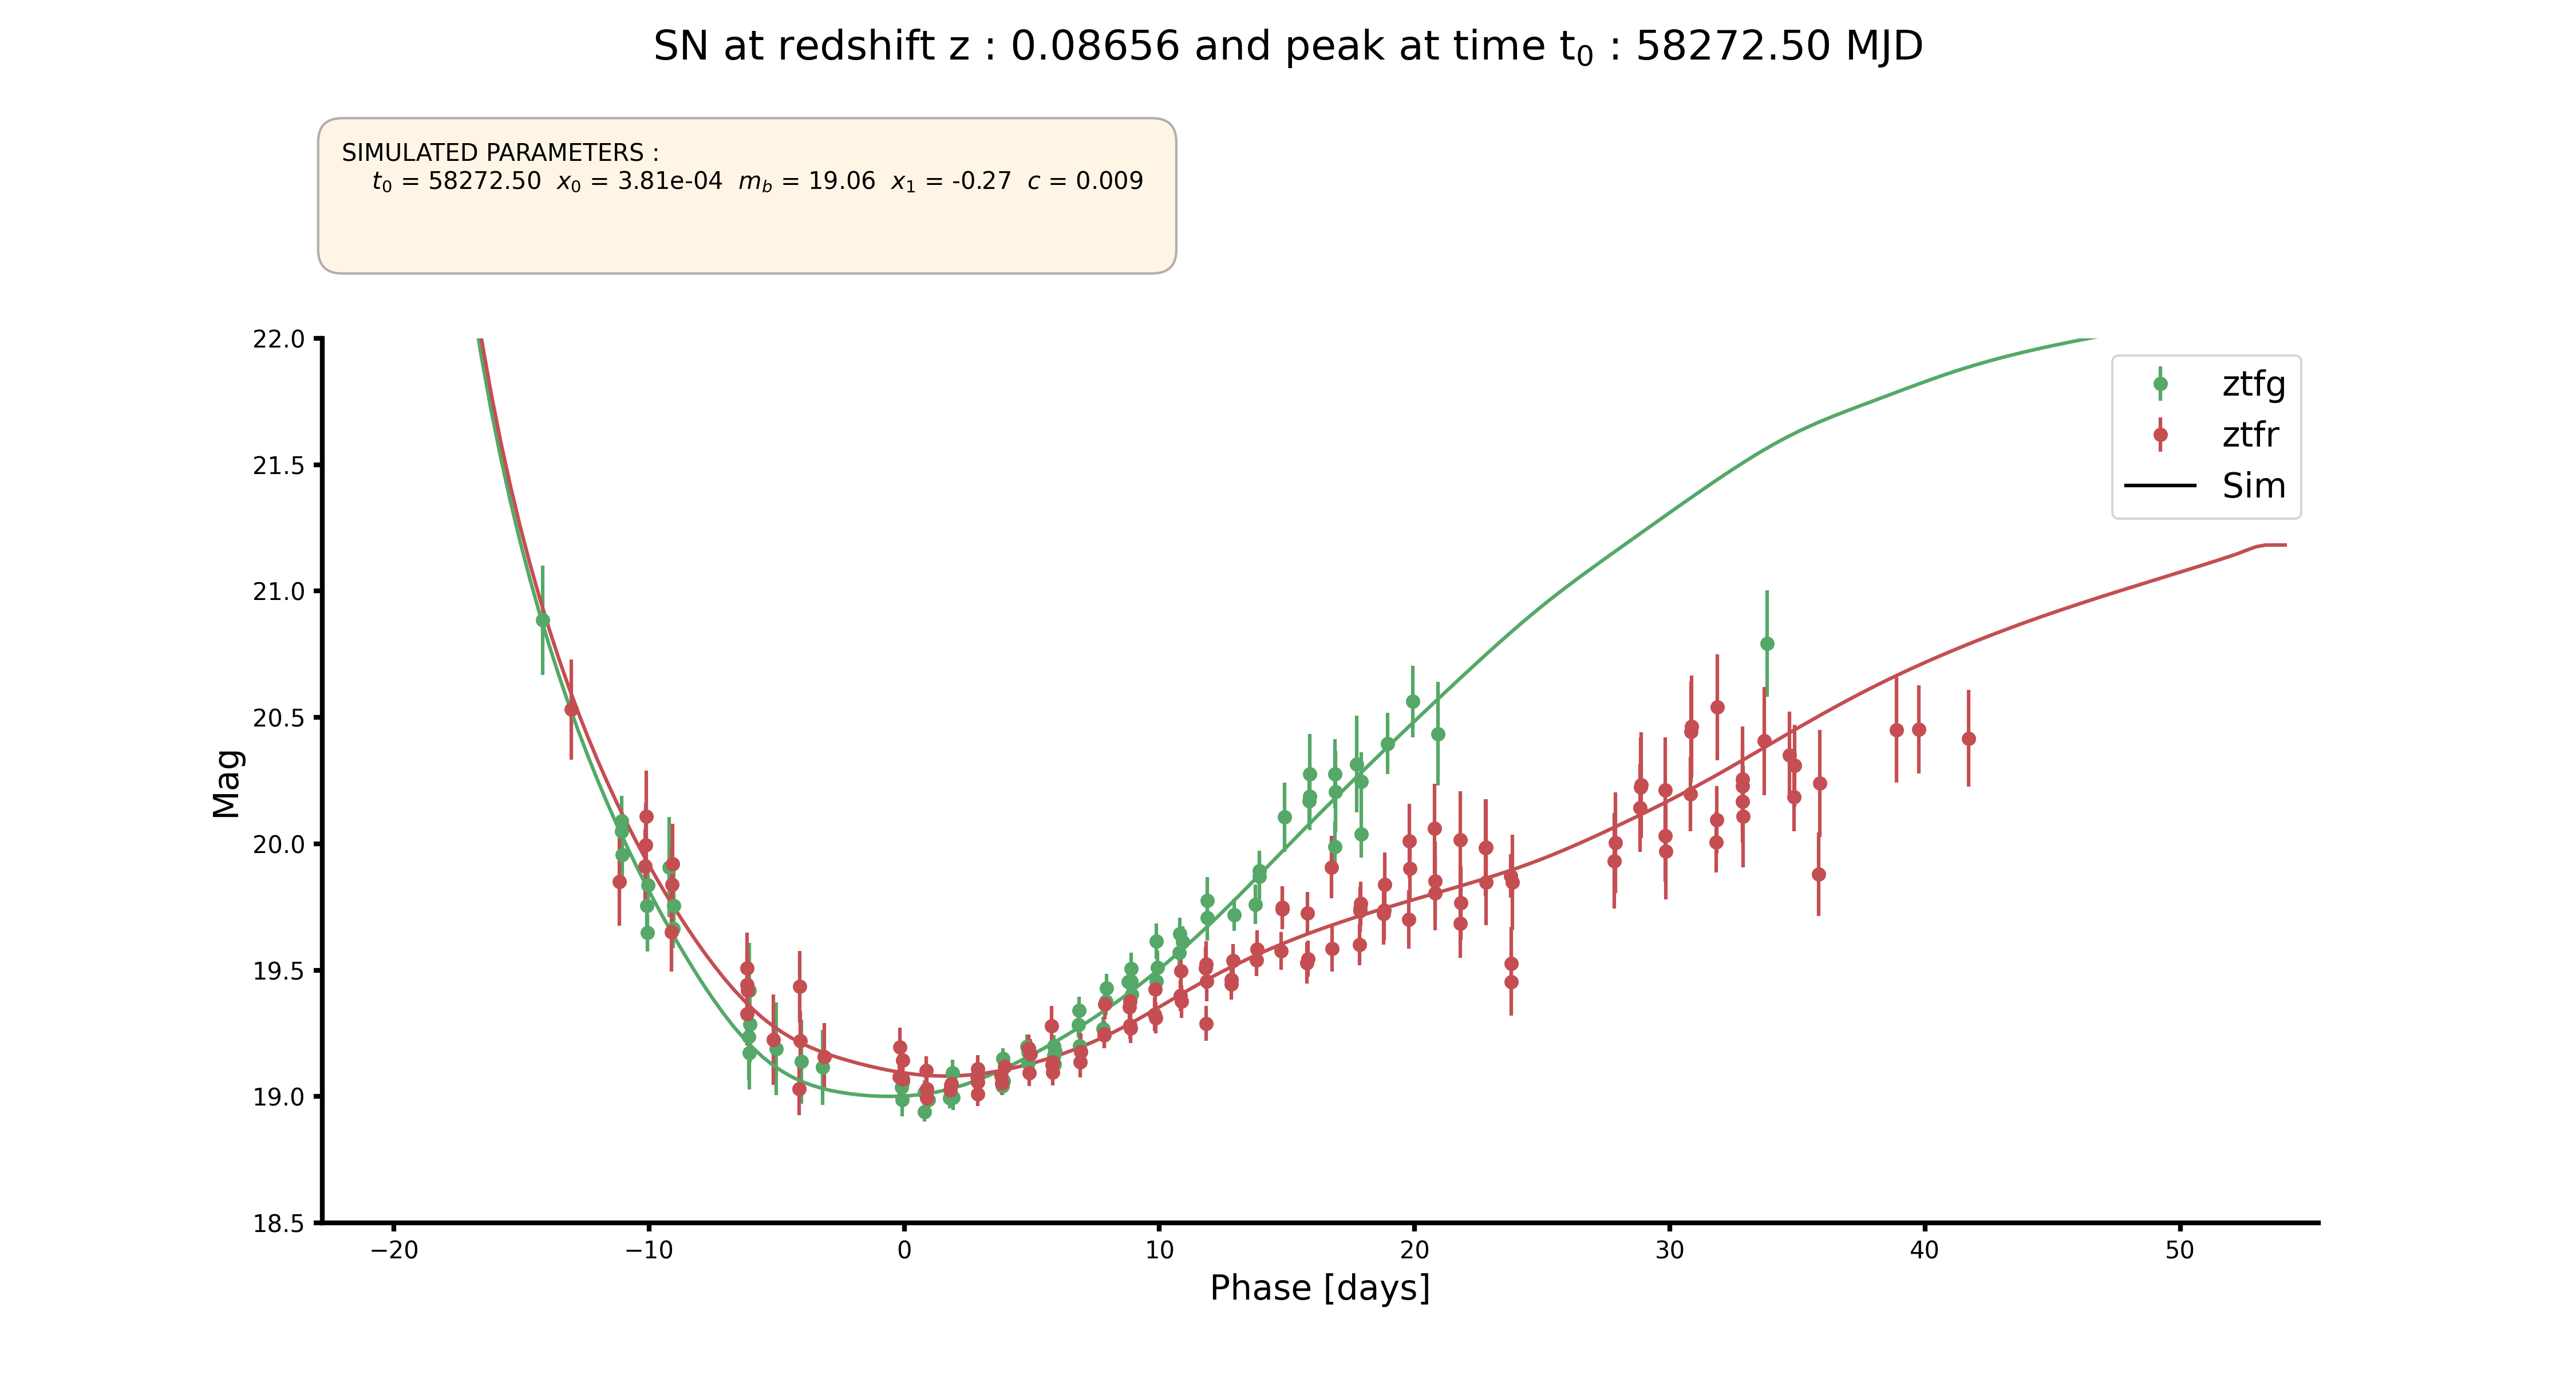
The same plot can be show in magnitude :
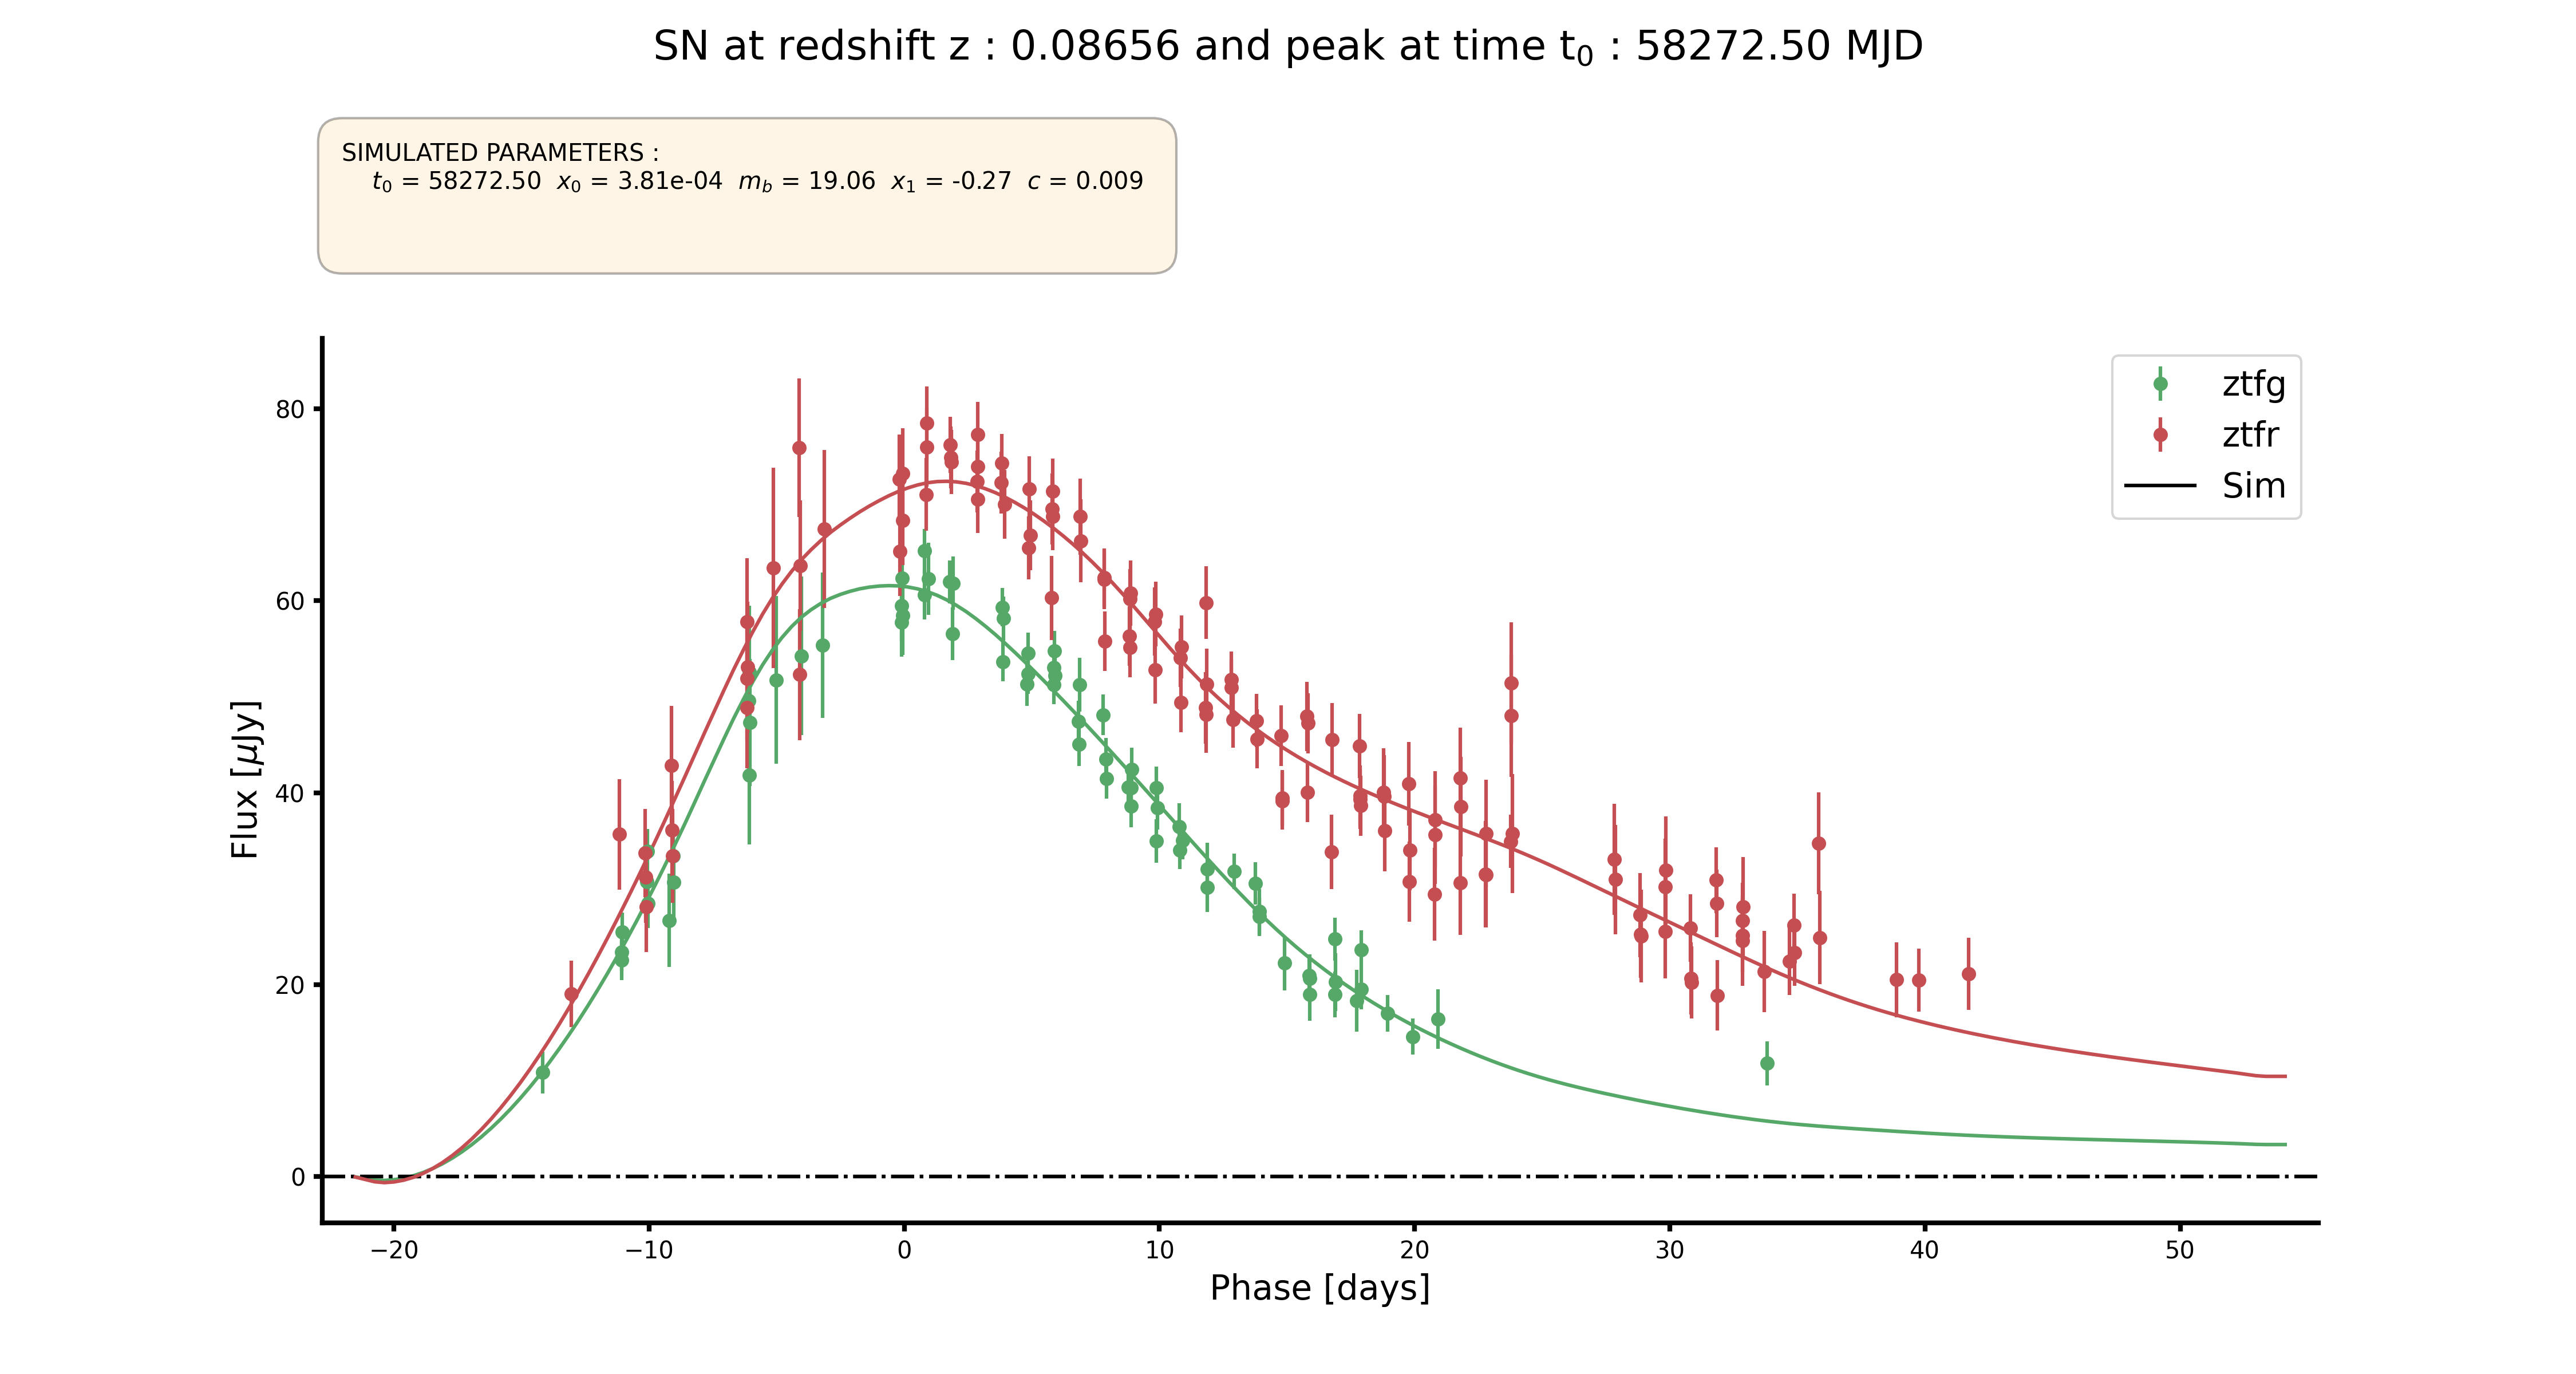
Or in Jansky :
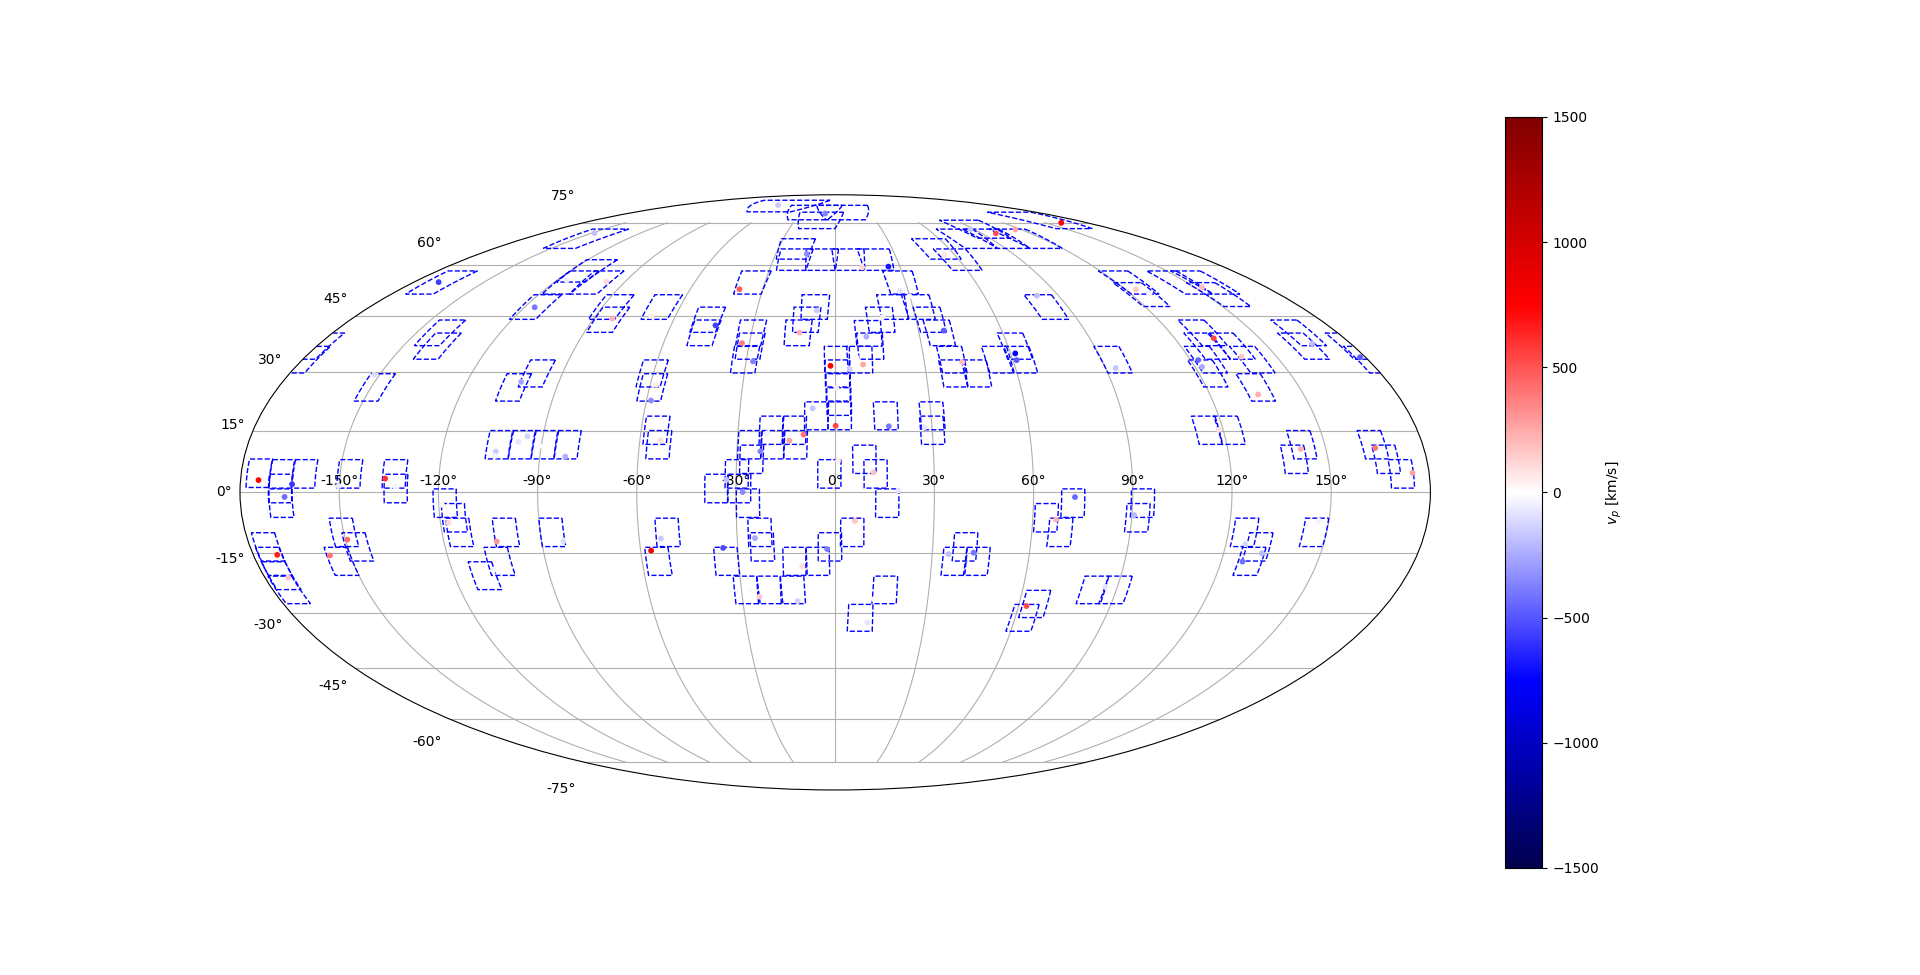
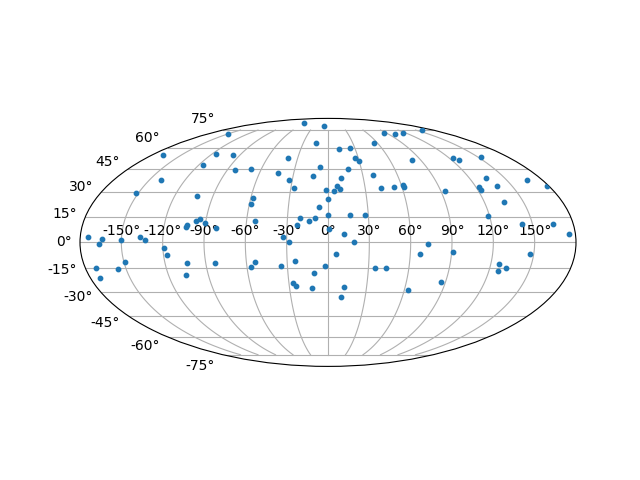
Mollweide map
You can plot the directly after simulation or using the SNSimSample module. But the plot_field option doesn’t work with SNSimSample unless you give a field_dic and field_size.
You can pass kwargs for matplotlib scatter function.
# From Simulation class :
sim.plot_ra_dec(plot_vpec=False, plot_fields=False, **kwarg)

# From SNSimSample class :
sim.plot_ra_dec(plot_vpec=False, field_dic=None, field_size=None, **kwarg)

# field_dic is like:
field_dic = {Field_ID : {'ra' : ra_in_rad, 'dec' : dec_in_rad}}

# field_size is like:
field_size = [ra_size_in_rad, dec_size_in_rad]
Plot without peculiar velocities :
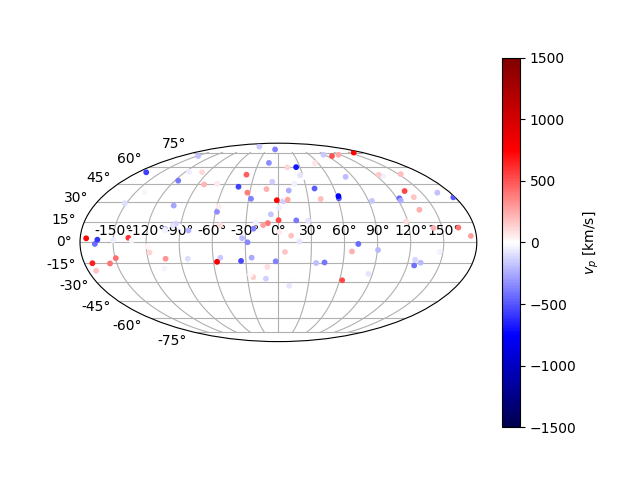
Plot with peculiar velocities :
Adding the fields :